
About this report
This report was generated from data collected from 160 active COPA SR22 pilots. You can see the original survey here: http://tinyurl.com/sr22cruisesurvey. You can download PDF.
Table of Contents
What you will get out of this report
Who were the pilots behind this survey
What aircraft are counted in the survey
Actual cruise speed and fuel flow
Fuel flow vs TAS for NA lean of peak operations
What is the most efficient altitude for NA SR22?
Turbo SR22 performance at high and low altitudes
Are TKS/FIKI planes slower?
What is the fastest NA SR22 by generation?
Who gets the best range?
Are high hour NA SR22 engines slower and do they burn more fuel?
How do LoP vs RoP performance compare?
POH vs actual performance for NA
Who is the fastest SR22?
Conclusion
About the author
Frequently asked questions
What you will get out of this report
This report is for SR22 owners and buyers.
- How your SR22 performs compared to other SR22s
- How altitude affects performance
- Performance under rich of peak vs lean of peak operations
- Turbo vs normally aspirated flying
- Buyer’s guide for verifying performance in test flight
Who were the pilots behind this survey
- 160 active SR22 pilots responded to the survey, all COPA members
- Over 92,000 PIC hours in SR22 combined between pilots who responded
- Median PIC time in SR22 was 500 hours
- Most senior pilot had 4000 SR22 hours and least senior had 25 hours
 Table 1. SR22 hours flown by pilots who responded to this survey
Important terminology
LoP = Lean Of Peak
RoP = Rich OF Peak
NA = Normally Aspirated
TAS = true airspeed
GPH = gallons per hour
|
What aircraft are counted in the survey
- 160 SR22s included
- All models from a 2001 G1 2800 SMOH to 2015 FIKI Turbo SR22
- Even a supercharged G2 is included
Table 2. Aircraft included in survey
Actual cruise speed and fuel flow
The median TAS and fuel flow at cruise was computed for turbo, normally aspirated, lean of peak and rich of peak.
NA LoP
|
168.0 KTS ±3.4
|
13.5 GPH ±0.7
|
NA RoP
|
178.3 KTS ±3.4
|
17.0 GPH ±1.4
|
Turbo LoP
|
188.5 KTS ±6.76
|
16.5 GPH 0±.57
|
Table 3. Median TAS and median fuel flow at cruise with standard deviation
How fast is your SR22? The standard deviation tells us the range of typical TAS and fuel flow. For NA LoP with a 3.4 standard deviation, 164.6 KTS to 171.4 KTS is the normal range. 12.8 to 14.2 GPH is typical luel flow range. If your performance is outside of this range, you have an abnormally fast or slow machine. Later we’ll look at performance at varying altitudes.
Conclusions
The turbo aircraft cruise 10 KTS faster than NA RoP, yet burn 0.5 GPH less. If you want to go fast, the turbo is a more efficient traveling machine.
Fuel flow vs TAS for NA lean of peak operations

Table 4. Airspeed vs fuel flow for lean of peak, normally aspirated (NA)
The graph above illustrates fuel flow vs true airspeed.
- Top right are the fastest planes that burn most fuel.
- Bottom left are slowest that burn the lowest fuel flow.
- Top Left are most efficient: fastest, but lowest fuel flow.
- Bottom Right are least efficient: slow TAS, but high fuel flow.
Cruise altitude plays an important role in fuel management. We will explore this further by looking at high altitude and low altitude aircraft separately.
Rate yourself! Put a pin in that chart for your own performance values to see how efficient you are compared to the fleet.
What is the most efficient altitude for NA SR22?
To answer this question let’s separately look at planes that fly above 10,000’ and below 8,000’.
Cruise below 8,000;
|
169.0 KTS @ 14.4 GPH
|
Cruise above 10,000’
|
168.0 KTS @ 12.5 GPH
|
There is a 0.6% decrease in TAS and a 13% increase in fuel flow. Flying at high altitudes is extremely advantageous for range and saving money on avgas. Lower fuel flow is related to lower stress on the engine.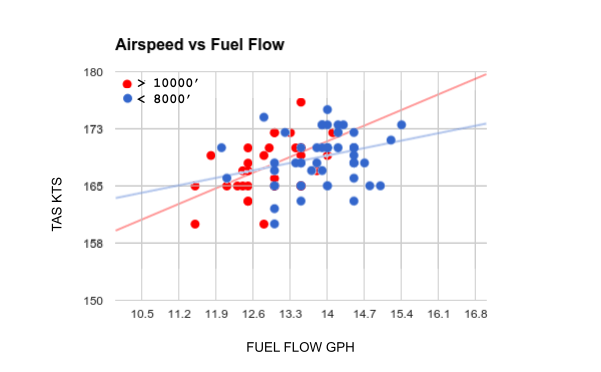
Table 5. Airspeed vs fuel flow for for high and low altitude fleet.
In the diagram above you can clearly see that the high altitude aircraft (red) trend towards the left side of the graph (lower fuel burn). The low altitude aircraft trend toward the right of the graph (high fuel burn). Airspeed is almost identical.
Key point: 1 GPH (Y axis) is 8% of fuel flow, while 1 KTS (vertical axis) is just 0.6% of TAS.
Table 6. Cruise altitudes for SR22 NA
The diagram above, ironically resembling a middle finger, clearly illustrates that majority of SR22 owners fly at an inefficient 8000’.
Summary: Flying at altitudes over 10,000’ gives you a 13% increase in range with just a 0.6% decrease in TAS.
Turbo SR22 performance at high and low altitudes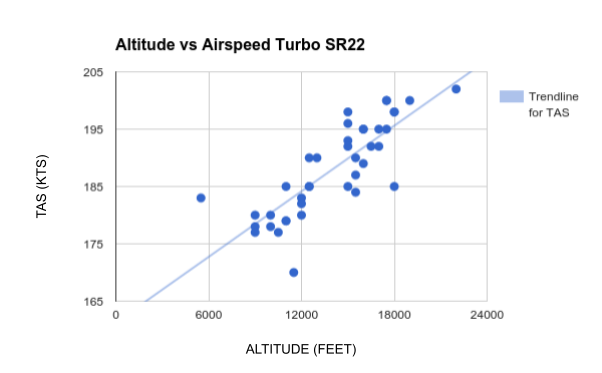
Table 7. True airspeed vs altitude for Turbo SR22
Bottom left of the graph represents low altitude aircraft with low TAS.
Top right of the graph represents high altitude aircraft with high TAS. It’s very easy to see that higher altitude means faster TAS. But to fully understand the picture we need to look at fuel flow.
Table 8. True airspeed vs fuel flow for Turbo SR22
The graph above illustrates fuel flow compared to altitude. As we can see here, fuel flow actually decreases as altitude increases. The higher you go, the faster you go and the less fuel you burn. Note below that many SR22 Turbo owners fly at low altitudes.
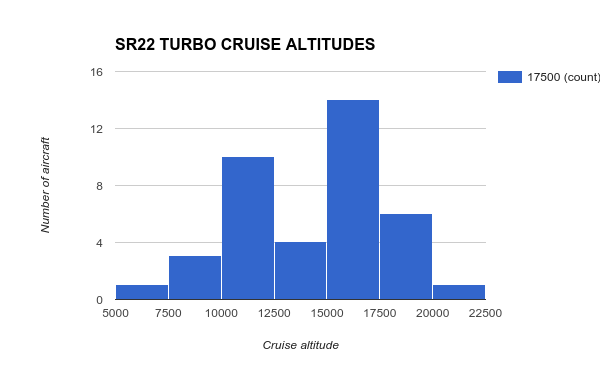
Table 7. Cruise altitude for SR22 Turbo.
Are TKS/FIKI planes slower?
TKS planes are on average 2 KTS slower than planes without TKS. Only the NA fleet was sampled for this test since virtually all turbos have TKS or FIKI.
NA With TKS (31 aircraft)
|
167.0 KTS
|
No TKS (68 aircraft)
|
169.0 KTS
|
Table 9. Median true airspeed of TKS and non TKS NA aircraft.
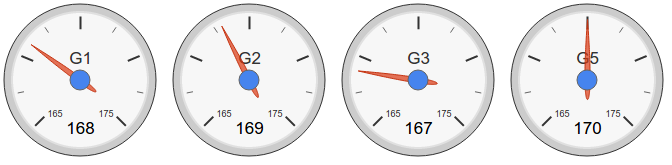
What is the fastest NA SR22 by generation?
1ST PLACE: G5 @ 170.0 KTS
2ND PLACE: G2 @ 169.0 KTS
3RD PLACE: G1 @ 168.0 KTS
4TH PLACE: G3 @ 167.0 KTS
Notes: Cirrus didn’t make a G4. G5 pool only had 10 planes.
G1
|
G2
|
G3
|
G5
|
168 KTS 13.5 GPH
|
169.0KTS 13.5 GPH
|
167.0KTS 13.5 GPH
|
170 KTS 14.2 GPH
|
Table 10. True airspeed and fuel flow for NA G1-G5.
The G5 beats the G2 by 0.6% TAS but it burns 5% more fuel. G2 is the real winner.
Are high hour NA SR22 engines slower and do they burn more fuel?
We analyzed all NA planes. There is virtually no measurable performance loss in older engines. They fly the same TAS and burn the same fuel.
> 1700 SMOH
(11 planes)
|
> 1300 SMOH
(35 planes)
|
< 1300 SMOH
(64 planes)
|
< 700 SMOH
(21 planes)
|
168 KTS 13.5 GPH
|
168 KTS 13.5 GPH
|
168 KTS 13.6 GPH
|
169 KTS 13.9 GPH
|
Table 11. SR22 NA TAS and fuel flow by SMOH age.
Conclusion: defer overhaul as long as possible. The risks associated with infant mortality of new engines are high, and there is no measurable performance loss for old engines.
How do LoP vs RoP operations compare for NA SR22?
SR22 NA lean of peak
|
168 KTS 13.5 GPH
|
SR22 NA rich of peak
|
178 KTS 17.0 GPH
|
Percentage difference
|
+6% KTS +25% GPH
|
Table 12. SR22 NA Lean of peak vs rich of peak performance.
RoP decreases cruise time by 6% but increases fuel flow by 25%. That’s a hefty 20% decrease in range. Operating RoP at cruise is far less efficient than operating LoP,
POH vs actual performance for NA
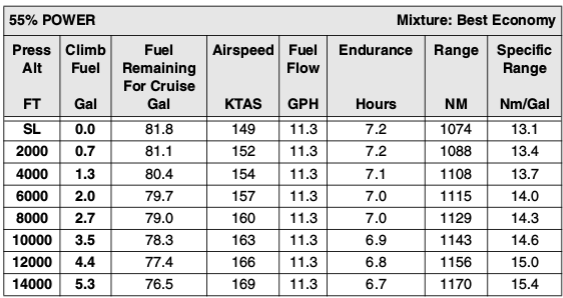
Table 13. SR22 NA POH 5-25 Range / Endurance Profile Best Economy
The Best Economy table shows a fuel flow of 11.3 GPH. None of the aircraft fly LoP with such low fuel flow so we cannot make a comparison. Cirrus likely achieved these performance numbers by closing down the throttle.
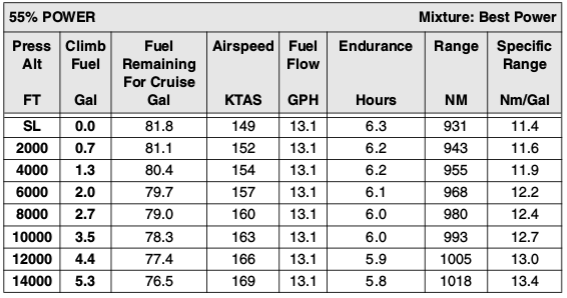
Table 14. SR22 POH 5-25 Range / Endurance Profile Best Power
The best power POH table fuel flow and TAS resemble what our aircraft see for actual LoP operation.
Altitude
FT
|
TAS
KTAS |
Fuel Flow
GPH
|
POH COMPARISON
% FUEL FLOW
|
POH COMPARISON
% TAS
|
Number of aircraft
|
7000-9000
|
168.0
|
13.95
|
+15.4%
|
+20%
|
38
|
9000-11000
|
167.0
|
13.2
|
+0.1%
|
+2.5%
|
17
|
11000-13000
|
167.5
|
12.5
|
-4%
|
+1%
|
8
|
Table 15. SR22 NA LoP performance by altitude
The Best Power POH table performance is in line with observed performance. Cirus should fix the POH for Best Economy or explain why this discrepancy exists.
Who is the fastest SR22?
Fastest turbo
|
202 KTS
|
22000’ G3, Turbo, TKS, 16.6 GPH
|
Fastest NA
|
181 KTS
|
2001 G1 14.3 GPH 8000’
Airplane was a 171 Kt. airplane until its last annual. At that annual (July 2014) we installed a DFC-90 and a Aspen PFC-1000. There was also some re-rigging. Plane gained 10 KTS. Thankful for the extra speed, but have no clue what resulted in increased speed. |
About the author
I own a G2 SR22 and I hold commercial instrument single- and multi-engine ratings. I work for Google as a staff engineer on infrastructure solving Google’s big data problems. I’ve flown my SR22 all over North and Central Americas including Honduras, Belize, Turks & Caicos and Canada.


Disclaimer
I am not affiliated with CIRRUS, COPA, and do not represent their interests. I conducted this study purely for self interest and published to share with others. I was not paid for this.
Conclusion
Does TAS variation matter? There is a big psychological factor here looking at numbers like 168 and 170. What if the TAS indicator showed % changes instead? Would you care so much if you speed dropped from 99% to 98%? Range, on the other hand is important. Pull that red knob back and fly a little leaner.
Frequently asked questions
Q: Why don’t we collect this data from the MFD flight recorder?
A: TAS from flight data is affected by external factors that are not recorded. Turbulence, downdrafts, overweight decrease performance. Updrafts and decreased weight increase performance. We need ground truth when the aircraft is operated in smooth air conditions near gross max weight.
Q: OAT, IAS will affect performance. How can we trust these numbers?
A: Variations caused by non standard atmospheric conditions, while important for a single sample, will become negligible with over 150 aircraft surveyed. The rule of averages comes into play.
Q: I want to run additional experiments on the data, can I access it?
A: Yes, contact me on COPA and I will share the data.
Q: Why did we not collect more details type of prop, engine RPM, etc.?
A: The variance caused by these details is so small it’s essentially a rounding error and not of interest to majority of owners.
ReplyDeleteTO ALL THESE PEOPLE POSTING THINGS LIKE THIS. AT LEAST YOU SHOULD MAKE SURE IT WORKS. CUZ NOBODY WANTS AN ALMOST file
The Copa Cirrus Sr22 Performance Report >>>>> Download Now
ReplyDelete>>>>> Download Full
The Copa Cirrus Sr22 Performance Report >>>>> Download LINK
>>>>> Download Now
The Copa Cirrus Sr22 Performance Report >>>>> Download Full
>>>>> Download LINK zB