Hurricane study by data scientist: surprisingly I am not seeing the explosive growth

This report is an analysis on hurricanes, surprisingly I am not seeing the explosive growth that documentaries show. I took the raw list of hurricanes from wikipedia to make landfall in US 1850-2018 and did an analysis.
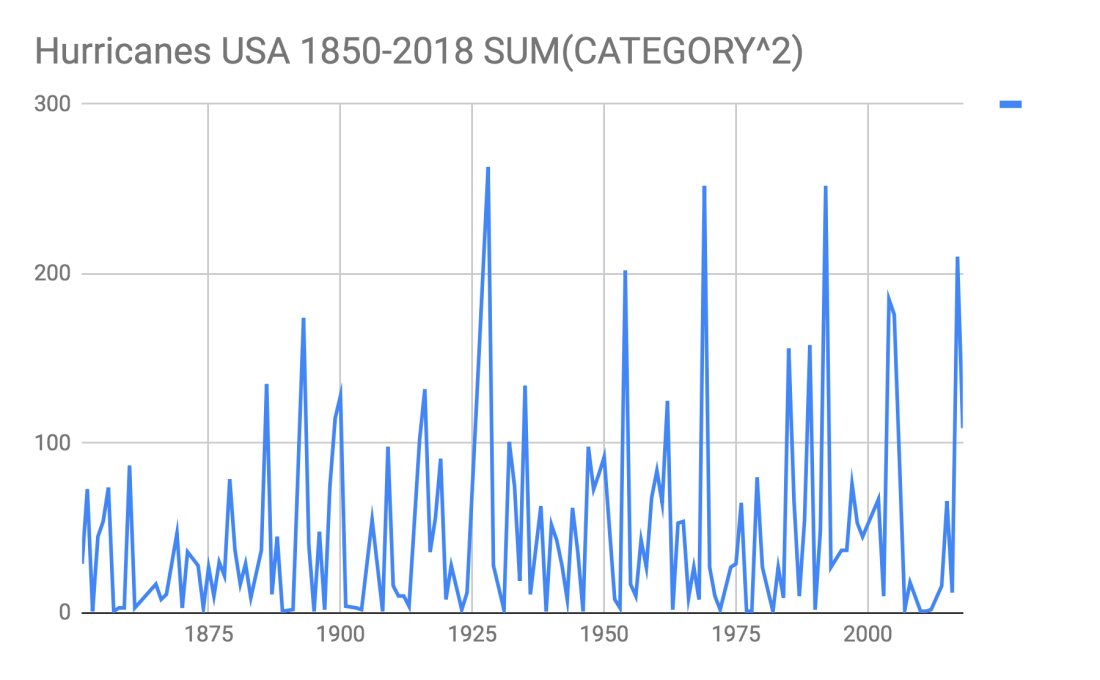
This is a “strength” study. Each hurricane gets points which is the square of its category, so cat 5 = 25 points, cat 2 = 4 points. It’s an annual study where we sum up the points of all hurricanes happening within one calendar year.
1.png
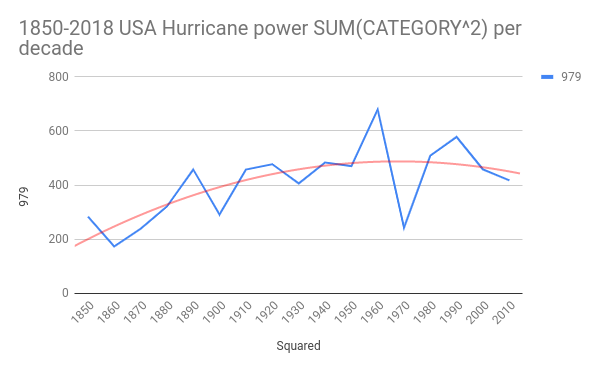
There is no clear pattern of exponential growth in strength. In fact in 2005 strength appears to be all time low. This is the same study by decade where we sum up the points of all hurricanes happening in 10 year periods.
7
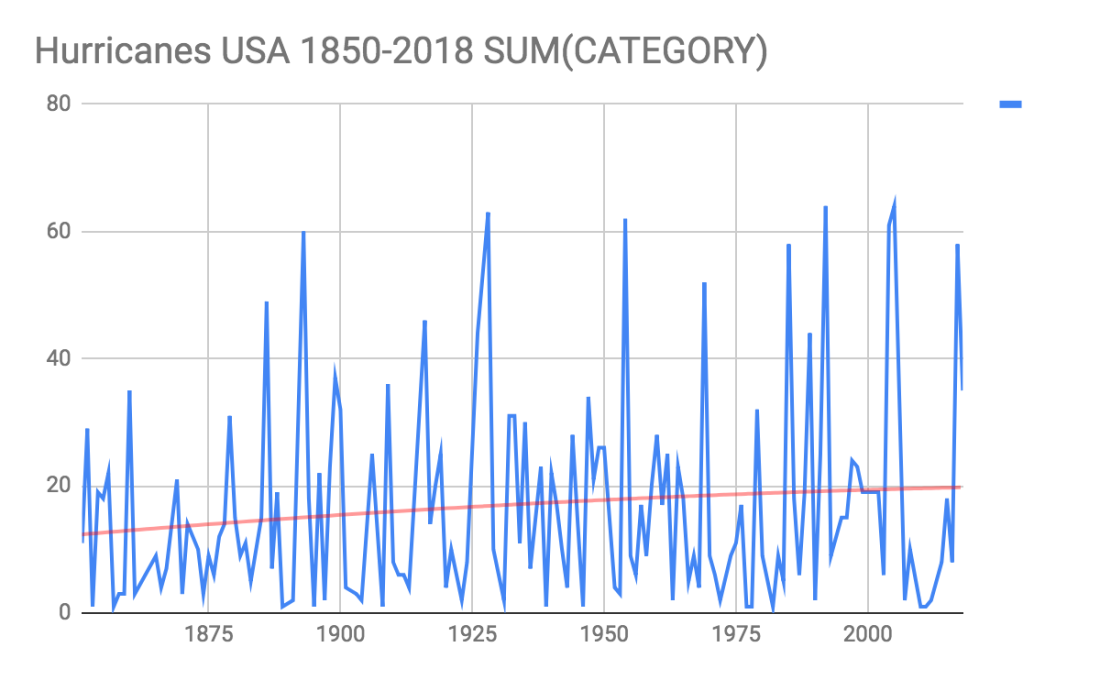
You may think the exponential scoring is unfair, so we can try a linear. Here, the points assigned to each hurricane is equal to its category. So two cat 3 hurricanes in one year = 6 points.
8.png
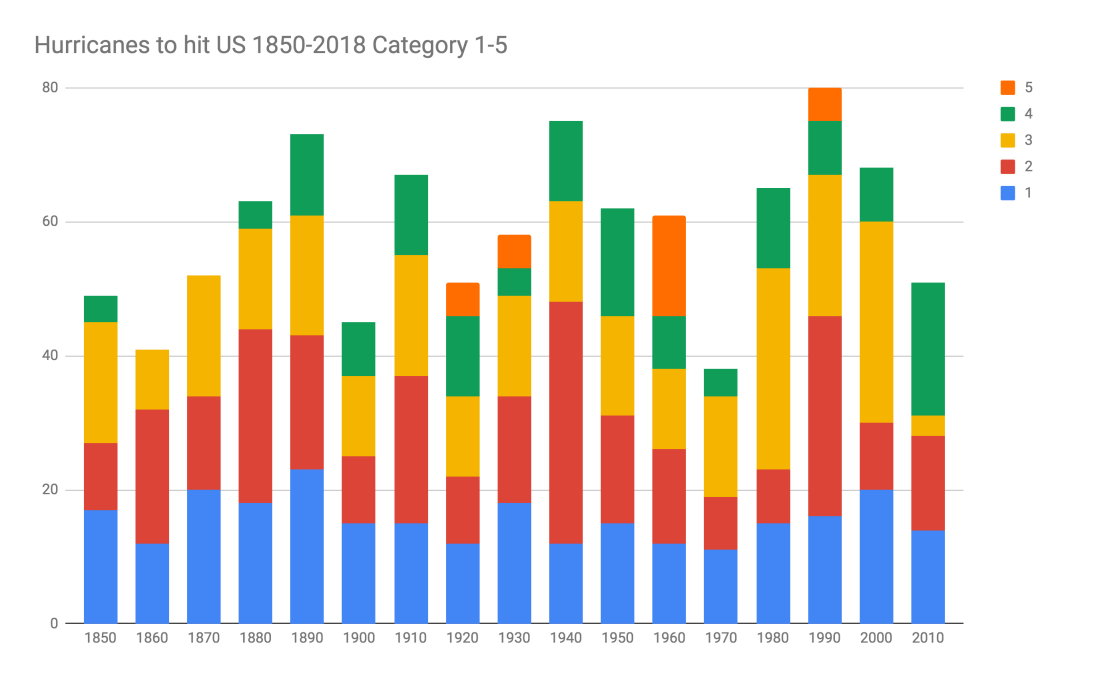
This is a color coded study showing counts by hurricane category. Here I added a polynomial trend line. Over 200 years see a linear increase, but this could be attributed to missing data in the 1800s. Did locals on Barbuda have a telegram to tell mainland about a category 4 hurricane that passed over and wiped everything off the map? Unluckily. Today everything is documented from space and NOAA airplanes.
3.png
Again you can see in the 1980s there was an increase in # of category 2, (red), but we see the same back 1920s.
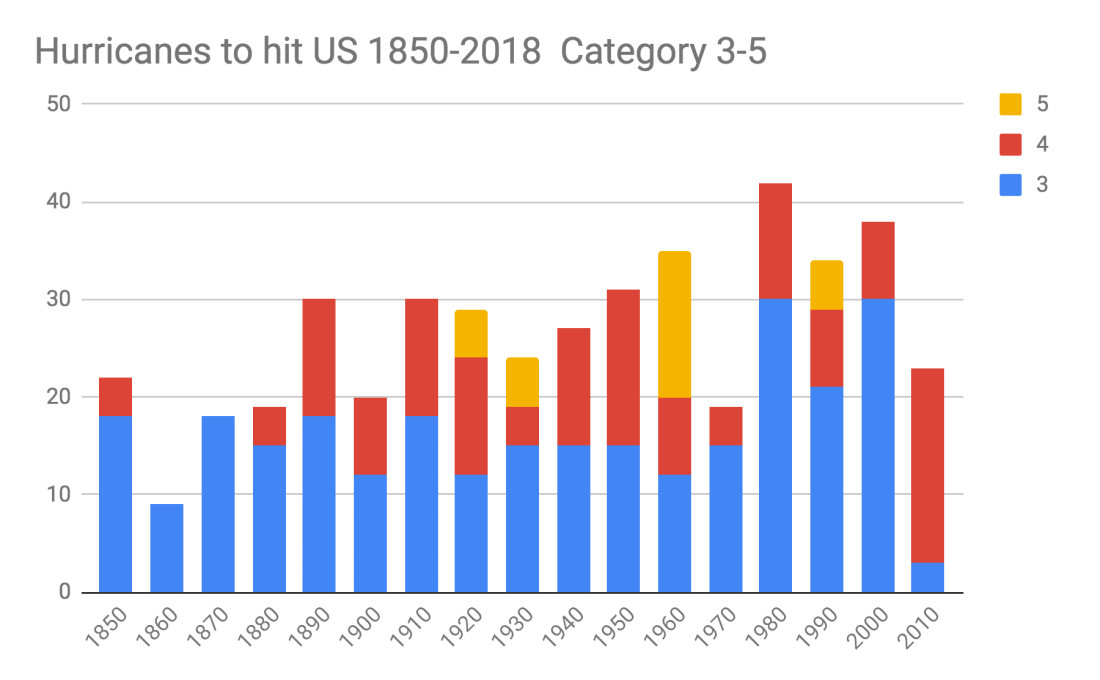
4.png
Above we show just category 3-5, we can see in 2010+ there are more category 4 than ever before, but there are far fewer cat 3 and no cat 5, and the 10 years prior had a record low, so not clear if there’s any pattern of intensification here.
Next up is an absolute count of hurricanes in north Atlantic (these typically pass through Caribbean). By pure count, we do see an upward trend. I added a 5 year trend line.
Again, I do wonder how accurate record keeping is from 1800s. The Caribbean and US had inhabitants and they could measure wind and send telegrams but did they really capture as much data as we get today? Pretty unlikely.
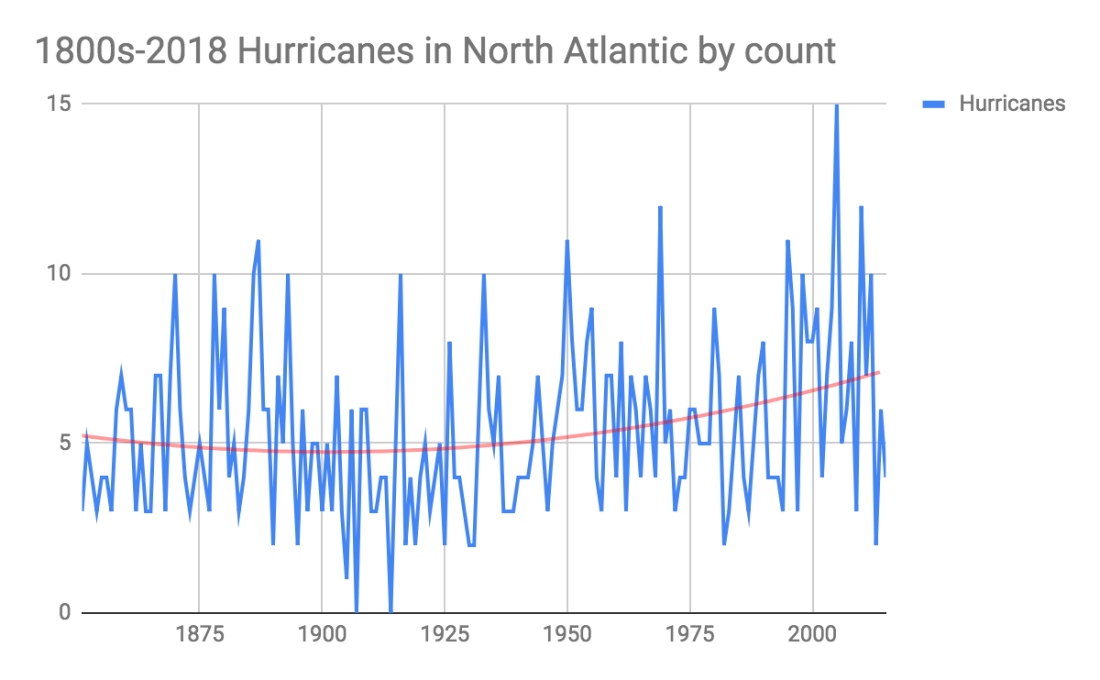
5.png
This graph covers just the more recent 1980-2018 time period, again, doesn’t look like a trend showing exponential growth.
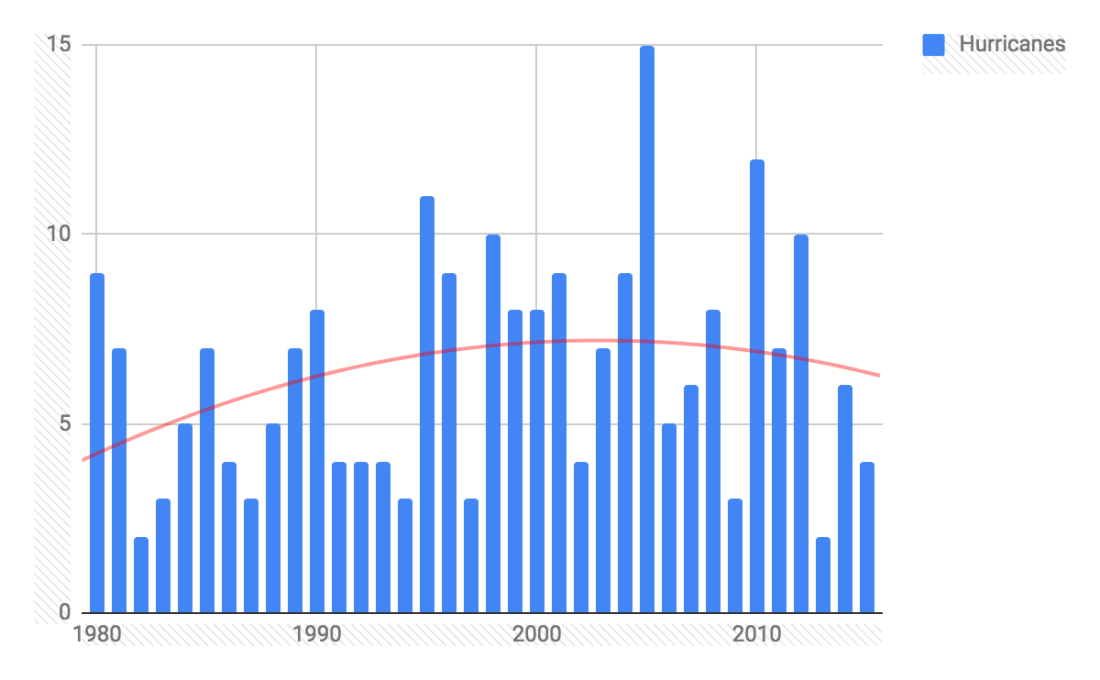
6.png
Data Sources: I grabbed data from  Wikipedia Hurricane Data and Hurricane Atlantic Data. and cleaned it up for analysis

Comments

Popular posts from this blog

How to get anything on EBAY for free (and get away with it)

This article explains how to get anything for free on Ebay. This is very simple, proven and guaranteed to work. You can get, for example, an IPhone 4, a 64GB IPad 2, or even a Macbook Pro laptop for free. 1. If the seller does not use delivery confirmation, you already won. Just tell ebay you never received the item. They will always side with you (bhe buyer) and refund your money, including shipping, AT THE SELLER'S EXPENSE. There is nothing the seller can do. Ebay will not investigate further, they close the case.  I have hard numerous reports of this happening.  See this facebook thread  and this article . The buyer now has no item, no money, and in addition he is out the cost of shipping. Totally screwed. 2. If you are dealing with a savvy seller, they will use delivery confirmation. Don't worry, you can still get your item for free. After you receive the item, open a case and claim the item broken. Let's use an IPhone 4 as an example. Open a claim and say the me...

THE COPA CIRRUS SR22 PERFORMANCE REPORT

About this report This report was generated from data collected from 160 active COPA SR22 pilots. You can see the original survey here: http://tinyurl.com/sr22cruisesurvey . You can download PDF . Table of Contents What you will get out of this report Who were the pilots behind this survey What aircraft are counted in the survey Actual cruise speed and fuel flow Fuel flow vs TAS for NA lean of peak operations What is the most efficient altitude for NA SR22? Turbo SR22 performance at high and low altitudes Are TKS/FIKI planes slower? What is the fastest NA SR22 by generation? Who gets the best range? Are high hour NA SR22 engines slower and do they burn more fuel? How do LoP vs RoP performance compare? POH vs actual performance for NA Who is the fastest SR22? Conclusion About the author Frequently asked questions What you will get out of this report This report is for SR22 owners and buyers. How your SR22 performs compared to other SR22s How altitude affects perfo...

How to hot start a Cirrus SR22

The SR22 does not like to normally start when the engine is hot. I use a simple procedure to hot start my SR22. My  Method 1. Prime 5 seconds 2. Throttle 1/4" open, mixture cutoff. 3. Start cranking and slowly advance mixture. 4. Once engine starts to fire, go mixture rich. Honestly I developed this through trial and error, I don't know exactly why it works but it does. I think this works because the prime step pumps cold fuel through the system to cool it down. Then cranking the engine with mixture cutoff pushes all the fuel and air bubbles out of the system, leaving room for clean fuel to be pumped in through cold fuel lies. CPPP Method At the 2015 CPPP in Williamsport we learned about another trick. Hot engine means hot fuel lines, which vaporize fuel (literally, fuel boils, air bubbles form). Engine doesn't want to start with part fuel part air being pumped in. You must cool down your fuel lines first. 1. Throttle closed, mixture cutoff. 2. Run boost pum...